From an alert to an incident, without the noise
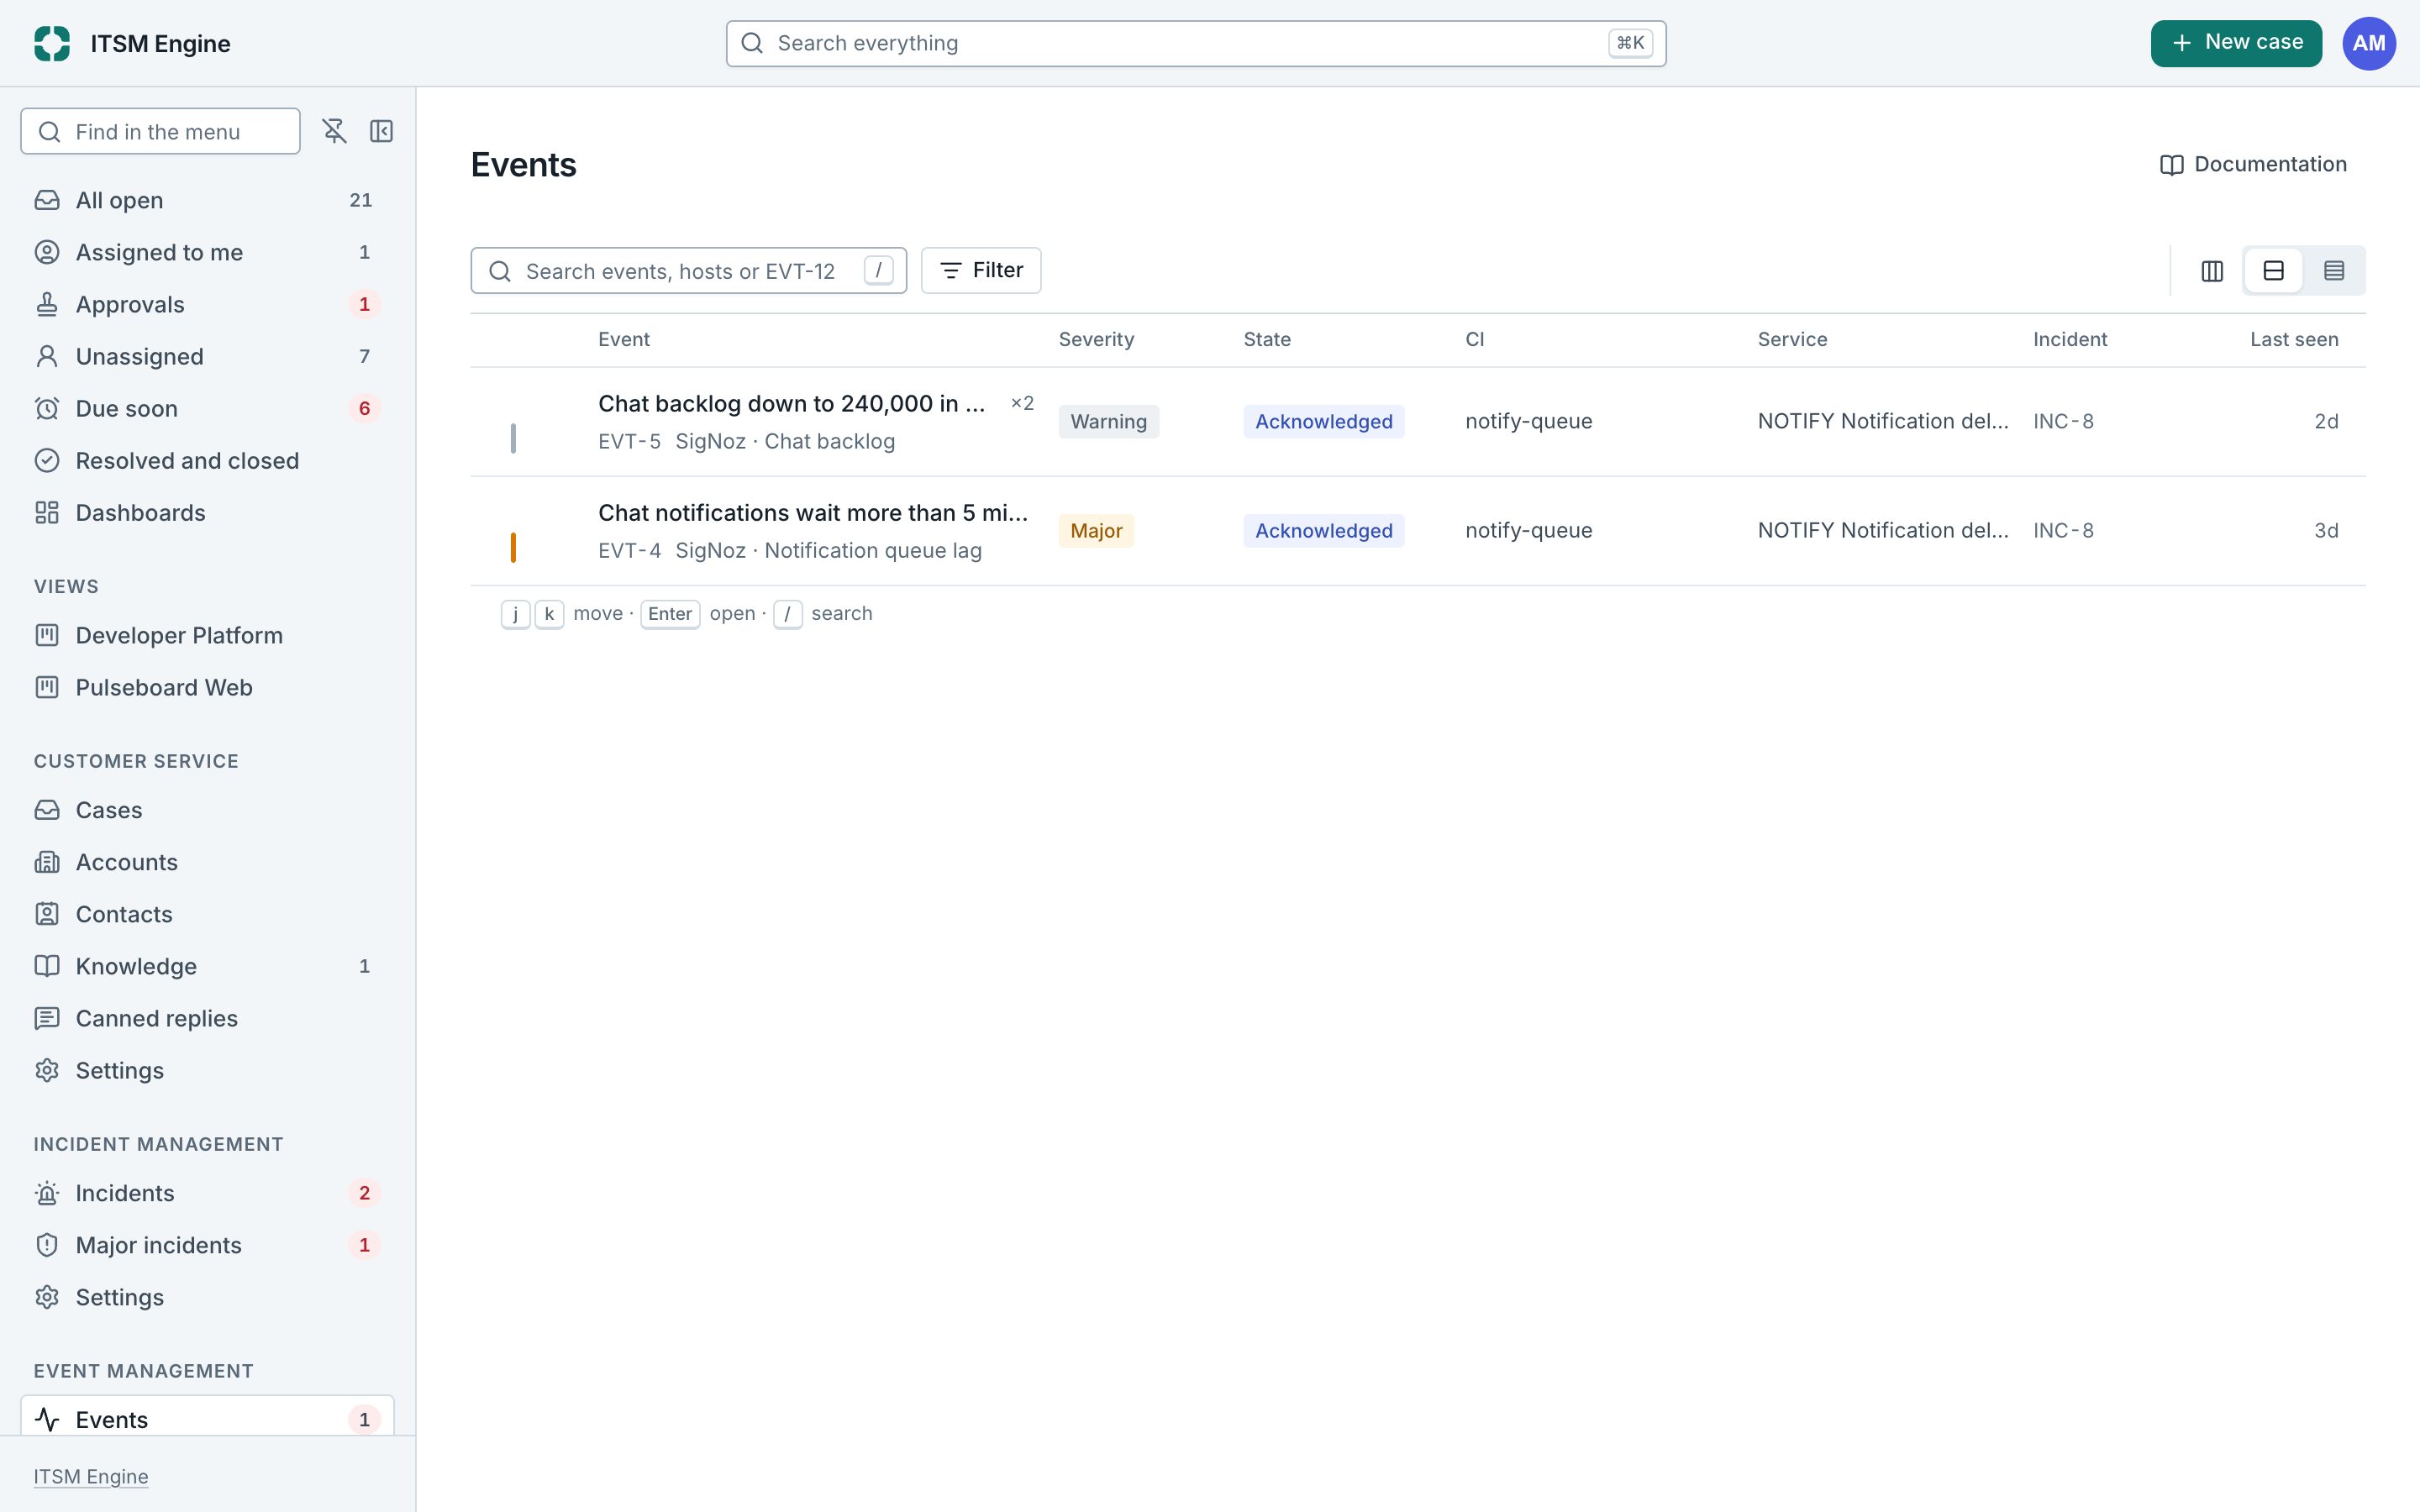
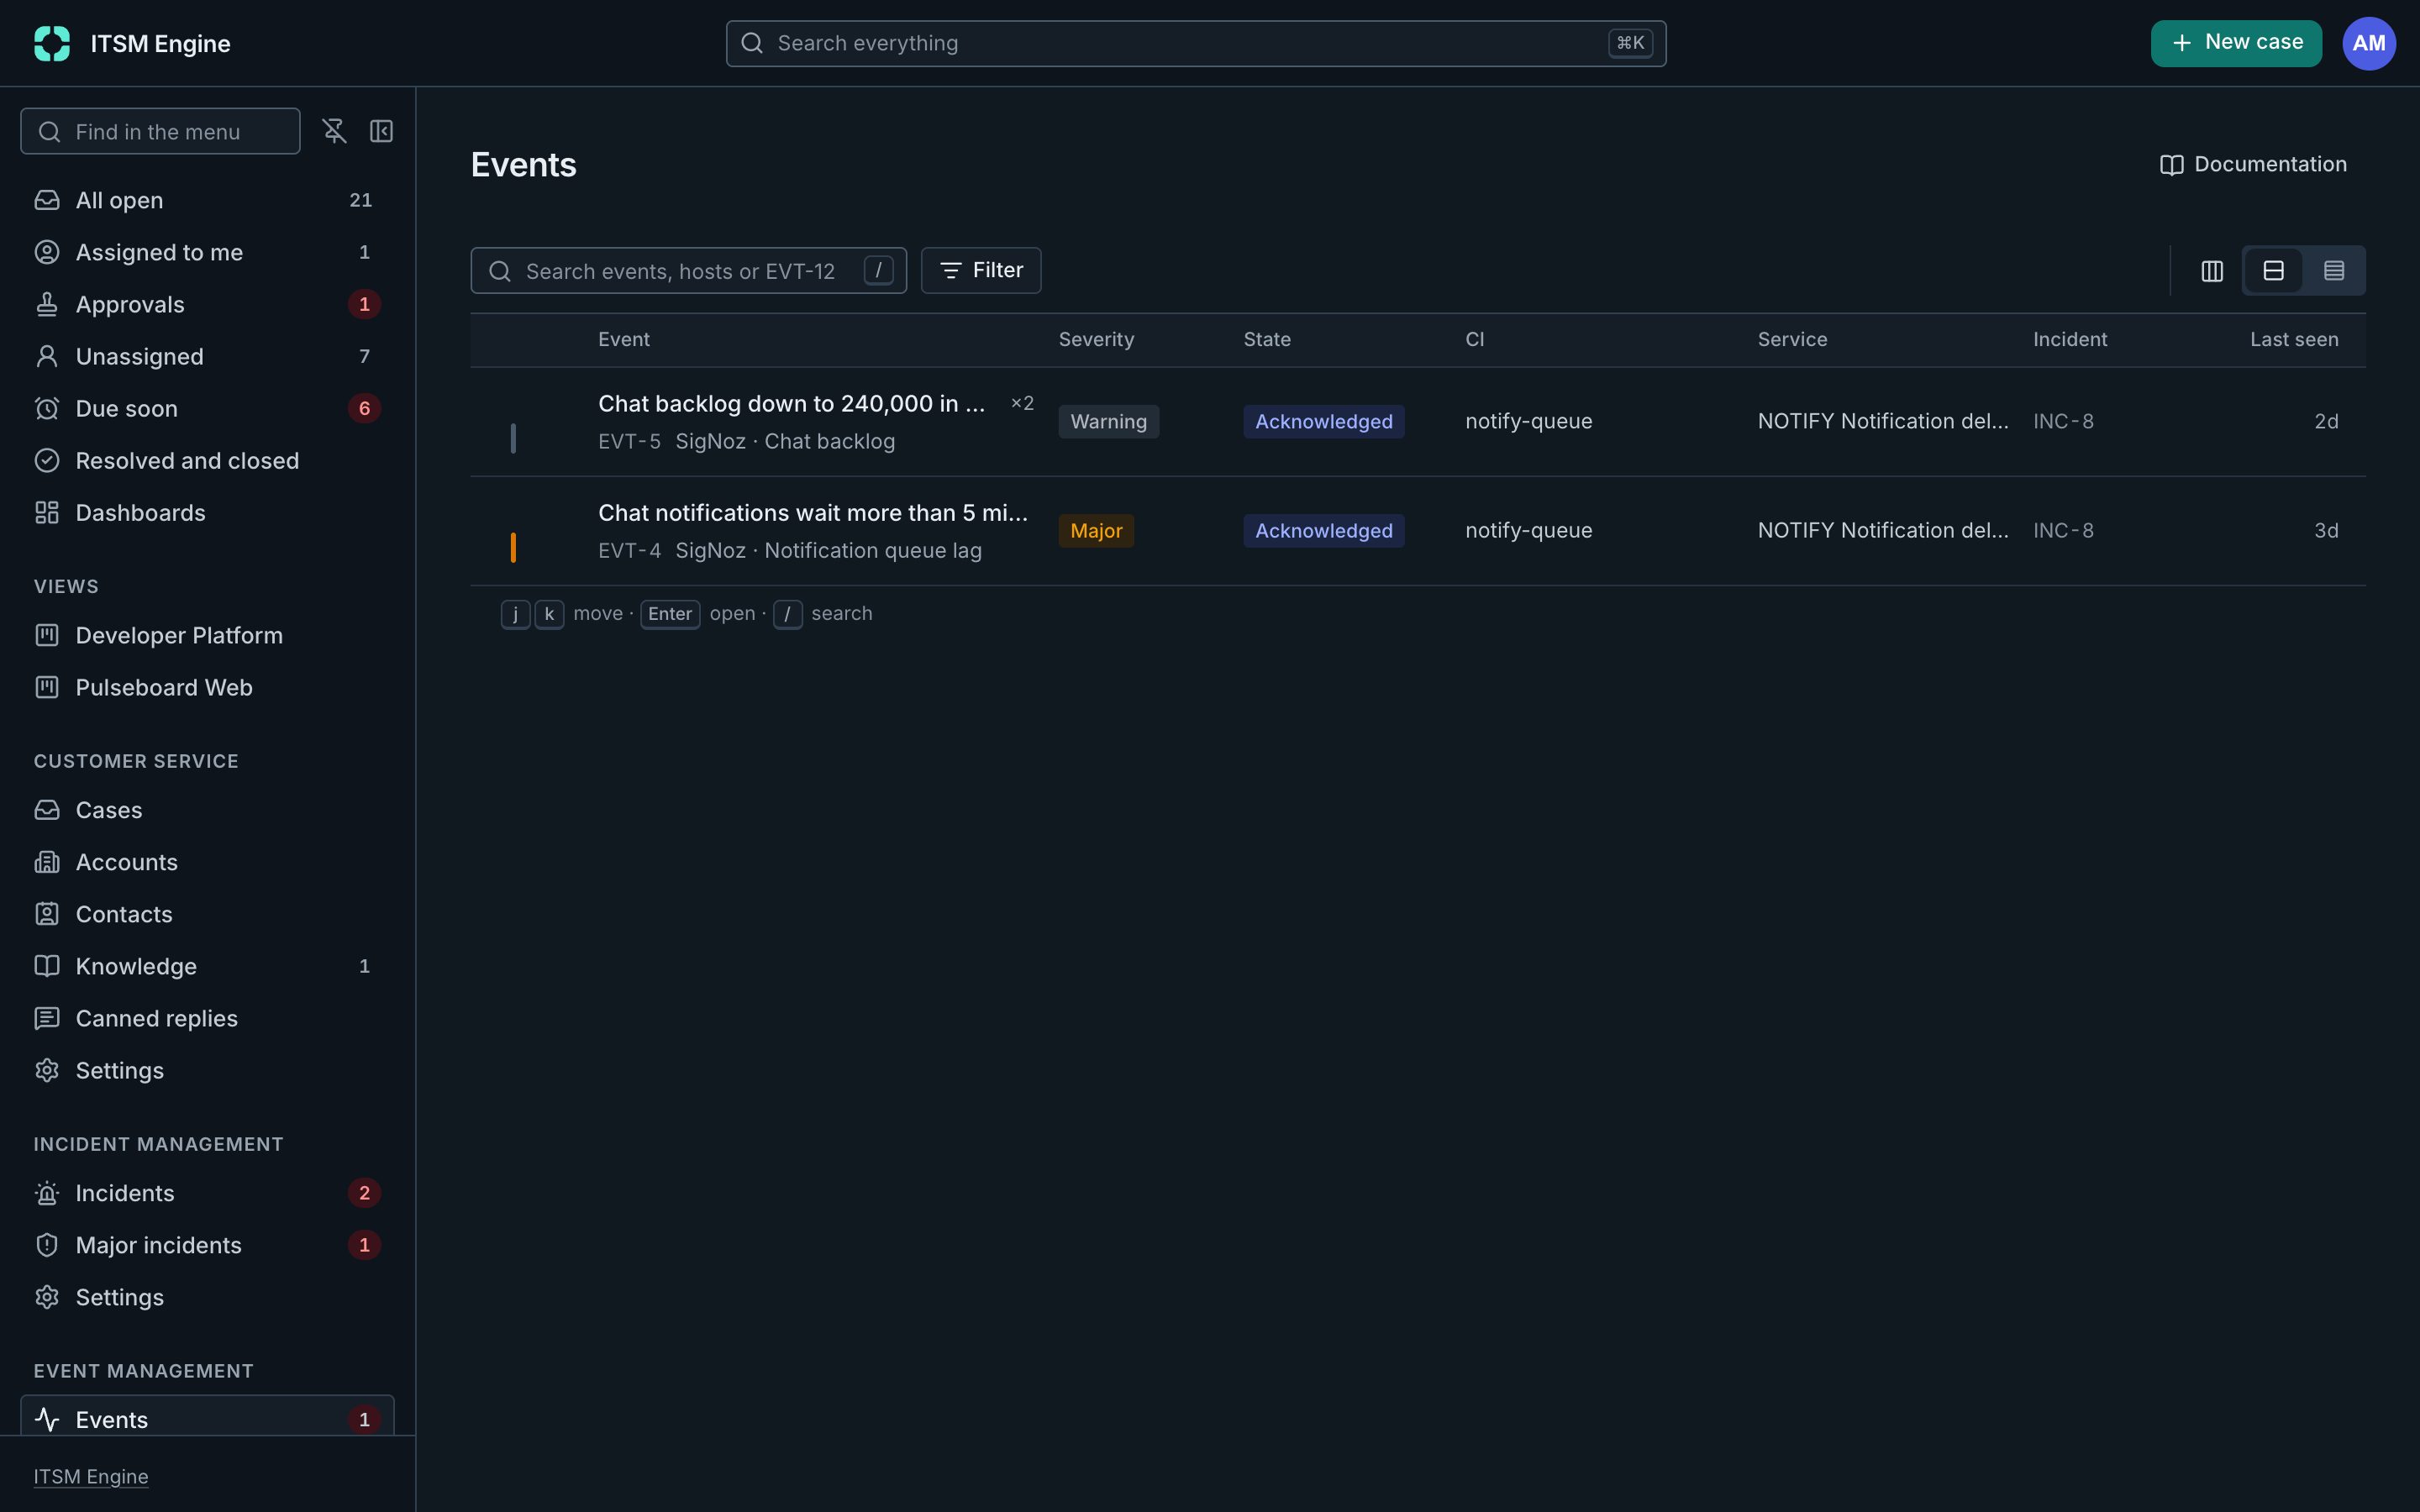
An event is something your monitoring noticed: a disk filling up, a health check failing. Events arrive through an integration and land on the Events console, matched to the configuration item and service they are about.
How it works
A monitoring tool repeats an alert while the problem lasts. The desk keeps one event for it, EVT-12, updated with how often it was seen and its severity, and closed as Cleared when the tool says it is over. SigNoz comes ready to connect, and any tool that sends JSON can be mapped.
Events are matched to configuration items by their identifiers and set their health, which the CMDB carries up to the services. Events during a change on their CI or service are suppressed, and an event on a CI with an open incident joins it.
Whoever watches the console acknowledges events, closes the noise and raises an incident with a click, or links one. Automations can raise incidents from events too, for example when one has lasted five minutes. Monitoring events are audit evidence.
Event Management is a plugin, and needs Service Configuration and Incident Management. An admin turns it on under Platform → Plugins, and turning it off hides it everywhere and keeps its data.
What it includes
One event per alert
Repeats update it, a clear closes it.
Matched to CIs and services
By identifier, setting their health.
Suppressed in changes
No alarm for work that was planned.
Raise or link an incident
By hand, or by an automation.
Integrations
SigNoz ready to connect, and generic JSON for anything else.
A dashboard
Open events, noise and what became incidents.